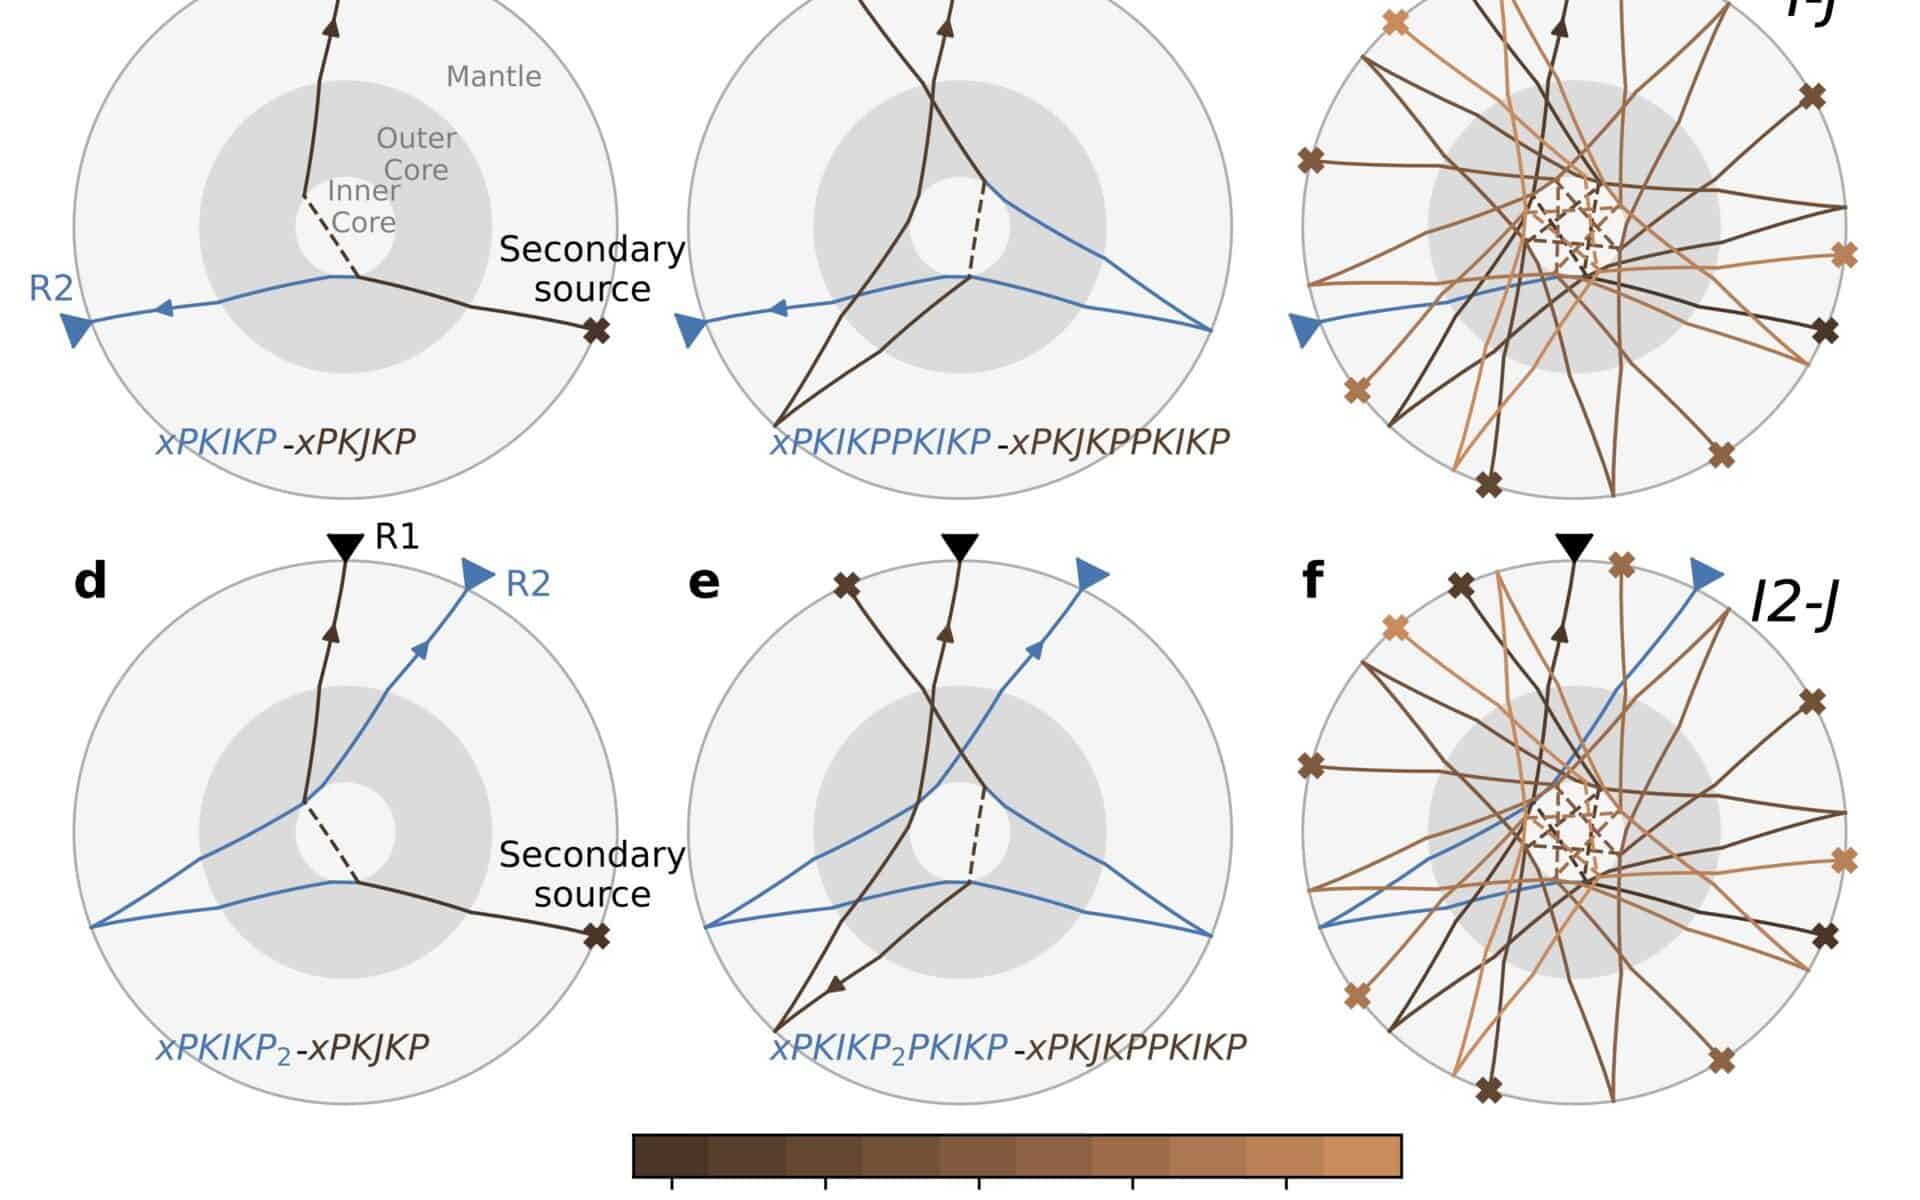
Seismologists know very well what a hard task it is to detect shear waves propagating through the inner core of the Earth. These signals are so weakly present in the earthquake records, that are often considered below the observational threshold. I have worked closely with Thanh-Son Pham, Xiaolong Ma, and Hrvoje Tkalčić to push forward our observational capabilities and use the similarity of noisy signals (3-10hrs seismic records after large earthquakes) to detect several spectacularly clear shear waves via the global coda-correlation wavefield. We estimate the **absolute shear-wave speed in the inner core**, and we find the inner core is less rigid than previously thought. Our new observation requires a re-assessment of the inner core composition, including the abundance of light elements, atomic properties and stable crystallographic phases of iron at high pressure and temperature conditions!
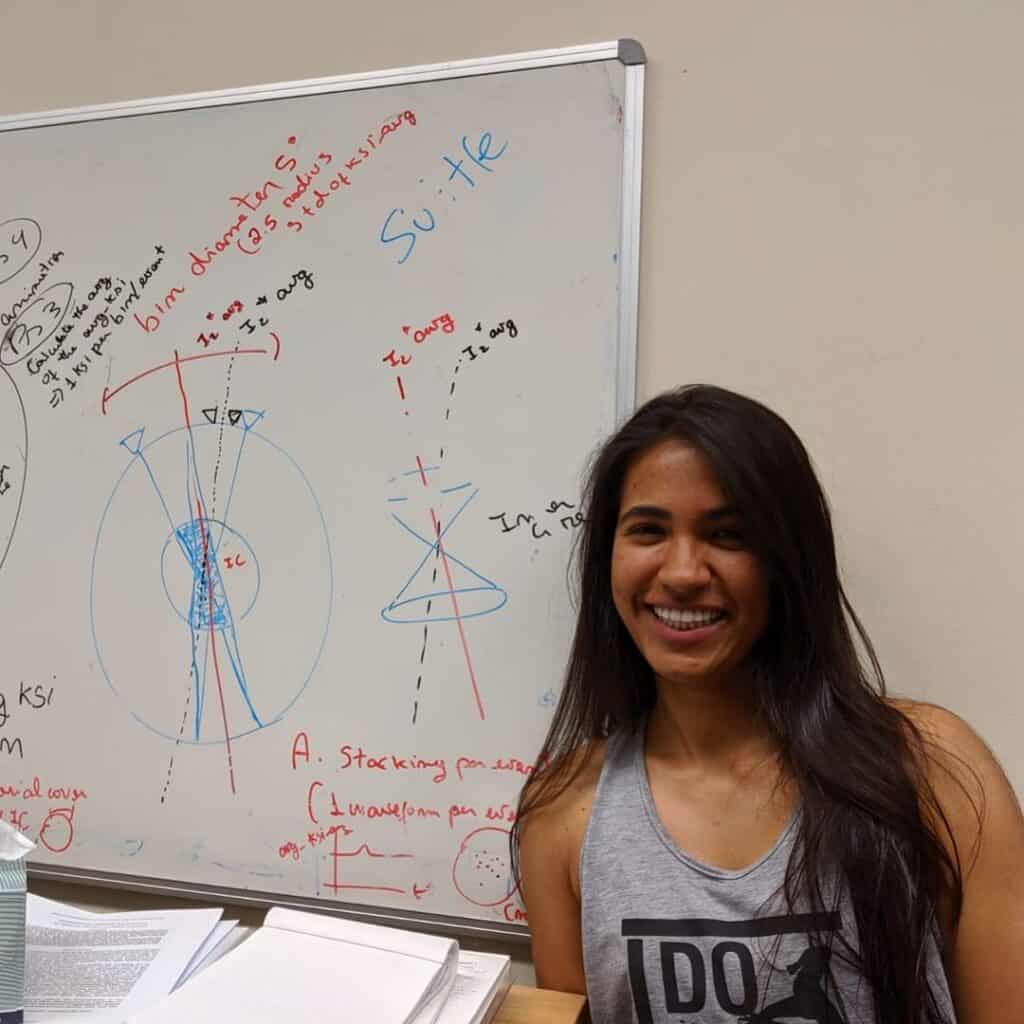
I am very honoured to be a recipient of the Mervyn and Katalin Paterson Fellowship 2022! So grateful to now have the chance to chat about my Ph.D. research and connect to researchers across Switzerland, France, and Queensland (here in Australia)! This photo of me was taken in 2019 when we were still brainstorming a method to help advance our knowledge of the Earth’s inner core.
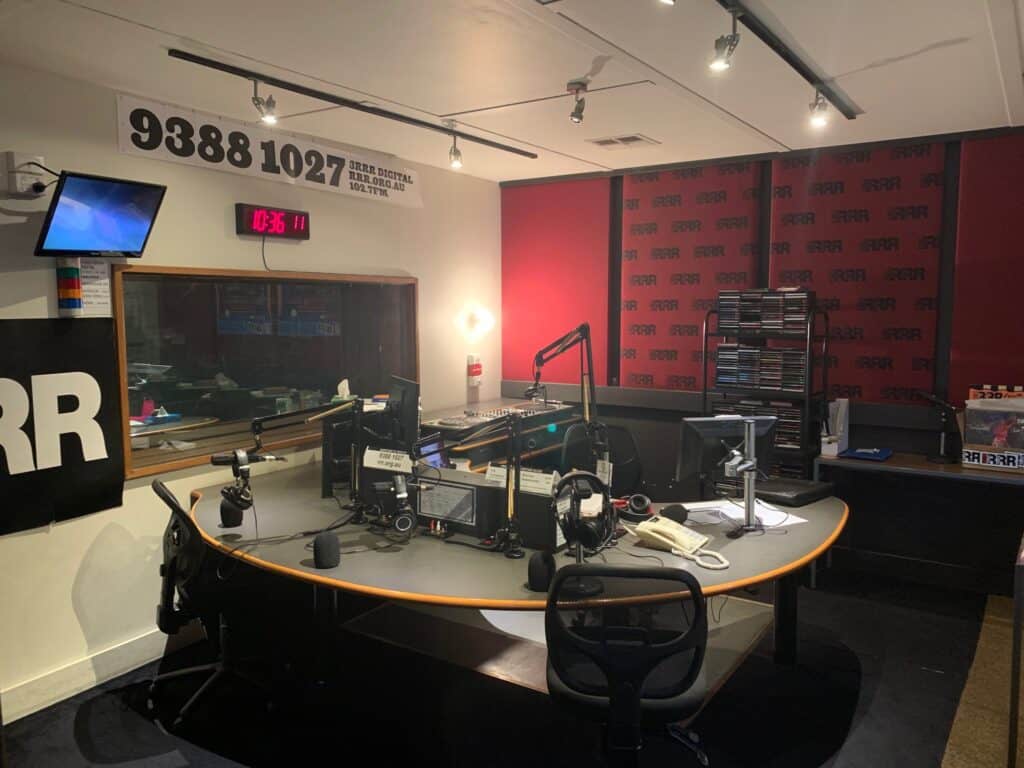
Very excited to chat about my Ph.D. research on the Earth’s #innercore with a group of talented Ph.D. candidates across Australia #20PhDs20Mins! Broadcasting this Sunday 17th of June at 11 am (Melbourne, AEST) @3RRRFM! Thank you @DrShaneRRR and @einstein_agogo for the opportunity!
Seismology is the study of the origin and propagation of seismic waves (or elastic waves) through the Earth and other bodies of our solar system. Seismic waves can be naturally generated by earthquakes around the globe – resulting from sudden changes in the Earth’s stress field, or it can be induced by human activity such as by hydraulic fracturing and nuclear explosions. When the seismic waves propagate through the Earth, they carry valuable information about the medium structure. This information can be detected by receivers (seismometers) deployed on the Earth’s surface.
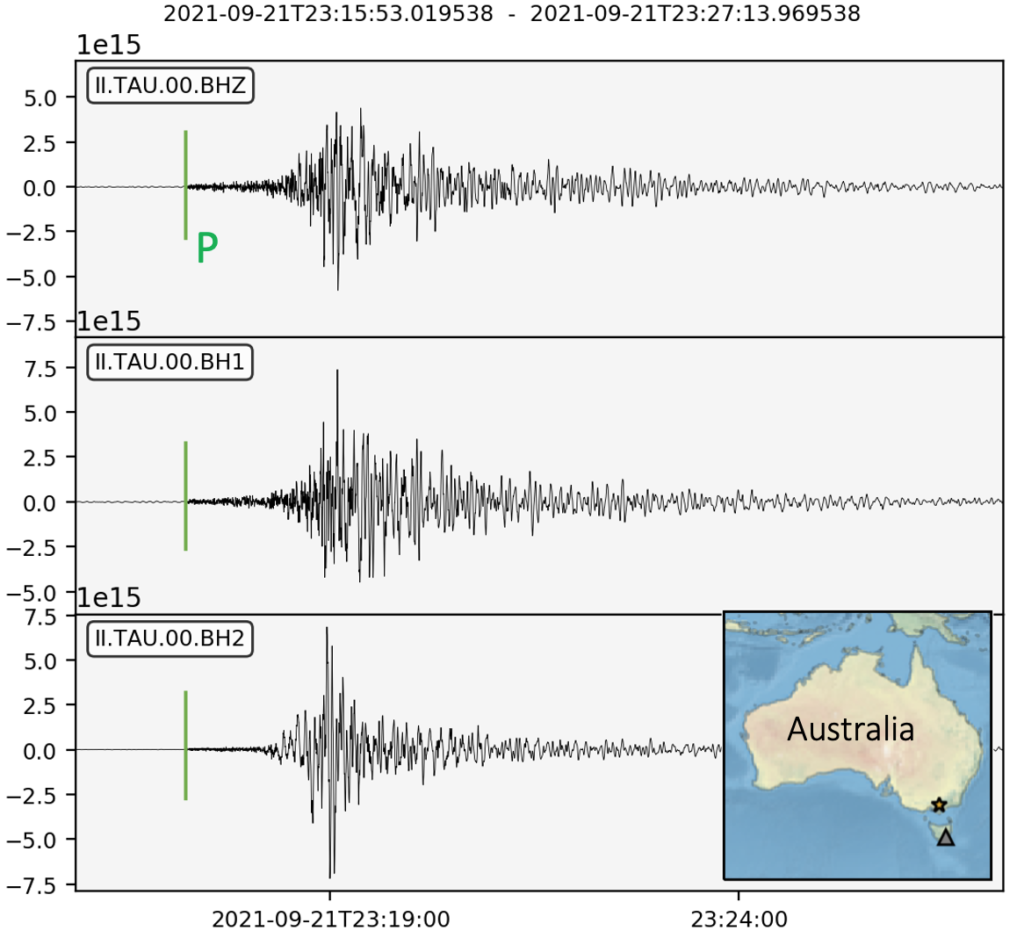
Seismograms (Figure 1) are time series that represent the record of ground motion detected by a receiver due to the passage of a seismic event (such as volcanic activity, landslides, anthropogenic seismicity… the list goes on!). By carefully examining these seismograms, we can investigate the origin of the seismic source (e.g., its location and nature) and the characteristics of the medium through which those waves have travelled.
What is an EarthQuake?
An earthquake is the movement of the ground caused by the sudden release of energy stored in the rocks. The energy radiates from the seismic source travelling as elastic waves and causes the ground to vibrate.
There are different reasons why we have earthquakes, in particular because the Earth is a very dynamic planet! Different types of forces (stress-field) drive the deformation we observe at the surface, creating a perfect condition for accumulation of energy in the crust. When the energy overcomes the limit of deformation, the rocks may abruptly fracture and move, causing an earthquake.
How can we decipher the seismogram into properties of the Earth structure?
Well, we can think of a seismogram as a complex overlapping of effects related to the seismic source, instrument, and the Earth’structure in between the source and receiver. Meanwhile we have a good knowledge about the instrumental response of the seismometer that is recording an earthquake, the source and Earth’ structure are more challenging to be determined, thus being the object of investigations of all seismologists.
On another post, I will describe a bit more about the waveform modelling (how we can mathematically decompose a seismogram), and introduce to you some fundamental equations.
Figure 1. Recordings of the ground displacement at different components of station TAU (Hobart, Tasmania, Australia) produced by seismic waves from an MW 5.9 earthquake in Victoria, Australia on 21st September 2021. Map to the right-bottom shows the earthquake (star) and station (triangle) location. Green lines indicate the approximate time arrivals of P wave.
!!! Seismograms displayed in Figure 1 !!!
There are multiple ways you can download the waveforms displayed above, such as by:
1) Using obspyDMT. Here is an example on the command line you can type on your terminal (make sure you have obspy installed in your machine!)
I was awarded a prize for the most inspiring early career research talk during the #auscope2021 conference and my book has finally arrived! Thank you so, So much, @auscopetoolkit for combining my passion for horses and earth sciences in a single package! I LOVE it💗
This research project was developed under the period of 3 months as part of the completion of the Girls Educating Girls initiative (Arecibo Observatory). Here, we explore the topic of “waves”, Unit F.5 of the Department of Education program in Physics, which covers the study of properties of mechanical and electromagnetic waves. We download and analyse records of electromagnetic radiation coming from two different sources: the sun (solar activity) and from out of the solar system (galactic cosmic rays) and aim to reproduce the results of previous studies. The primary goal of this project is to provide the student (Ms. Stephanie Rodriguez) the opportunity to advance on her computational skills, engage in scientific communication with her mentor, and build some research experience. The secondary goal of this project is to prepare the student to be able to communicate her newly scientific knowledge to the general public in schools across Puerto Rican community, and consequently, inspire female students to pursue their careers in STEM !
Overview
Nearly all objects vibrate or oscillate due to an external disturbance – the ground moves during the passage of an earthquake; the string of a guitar shakes after being plucked; spiders detect their prey by the vibration of their webs, or buildings vibrate when a heavy truck is passing by. Those vibrations are intimately related to the concept of wave motion. Waves have their source as a vibration (e.g. Giancoli, 1992), and they transfer energy from one place to another by propagating through the medium at different frequencies. In the universe, we can identify different sources of waves, such as an earthquake that generates acoustic waves, and stars within our solar system that generate electromagnetic waves. The study of the properties of these waves and how they propagate through multiple environments lead to a better understanding of how the Earth and the entire universe works.
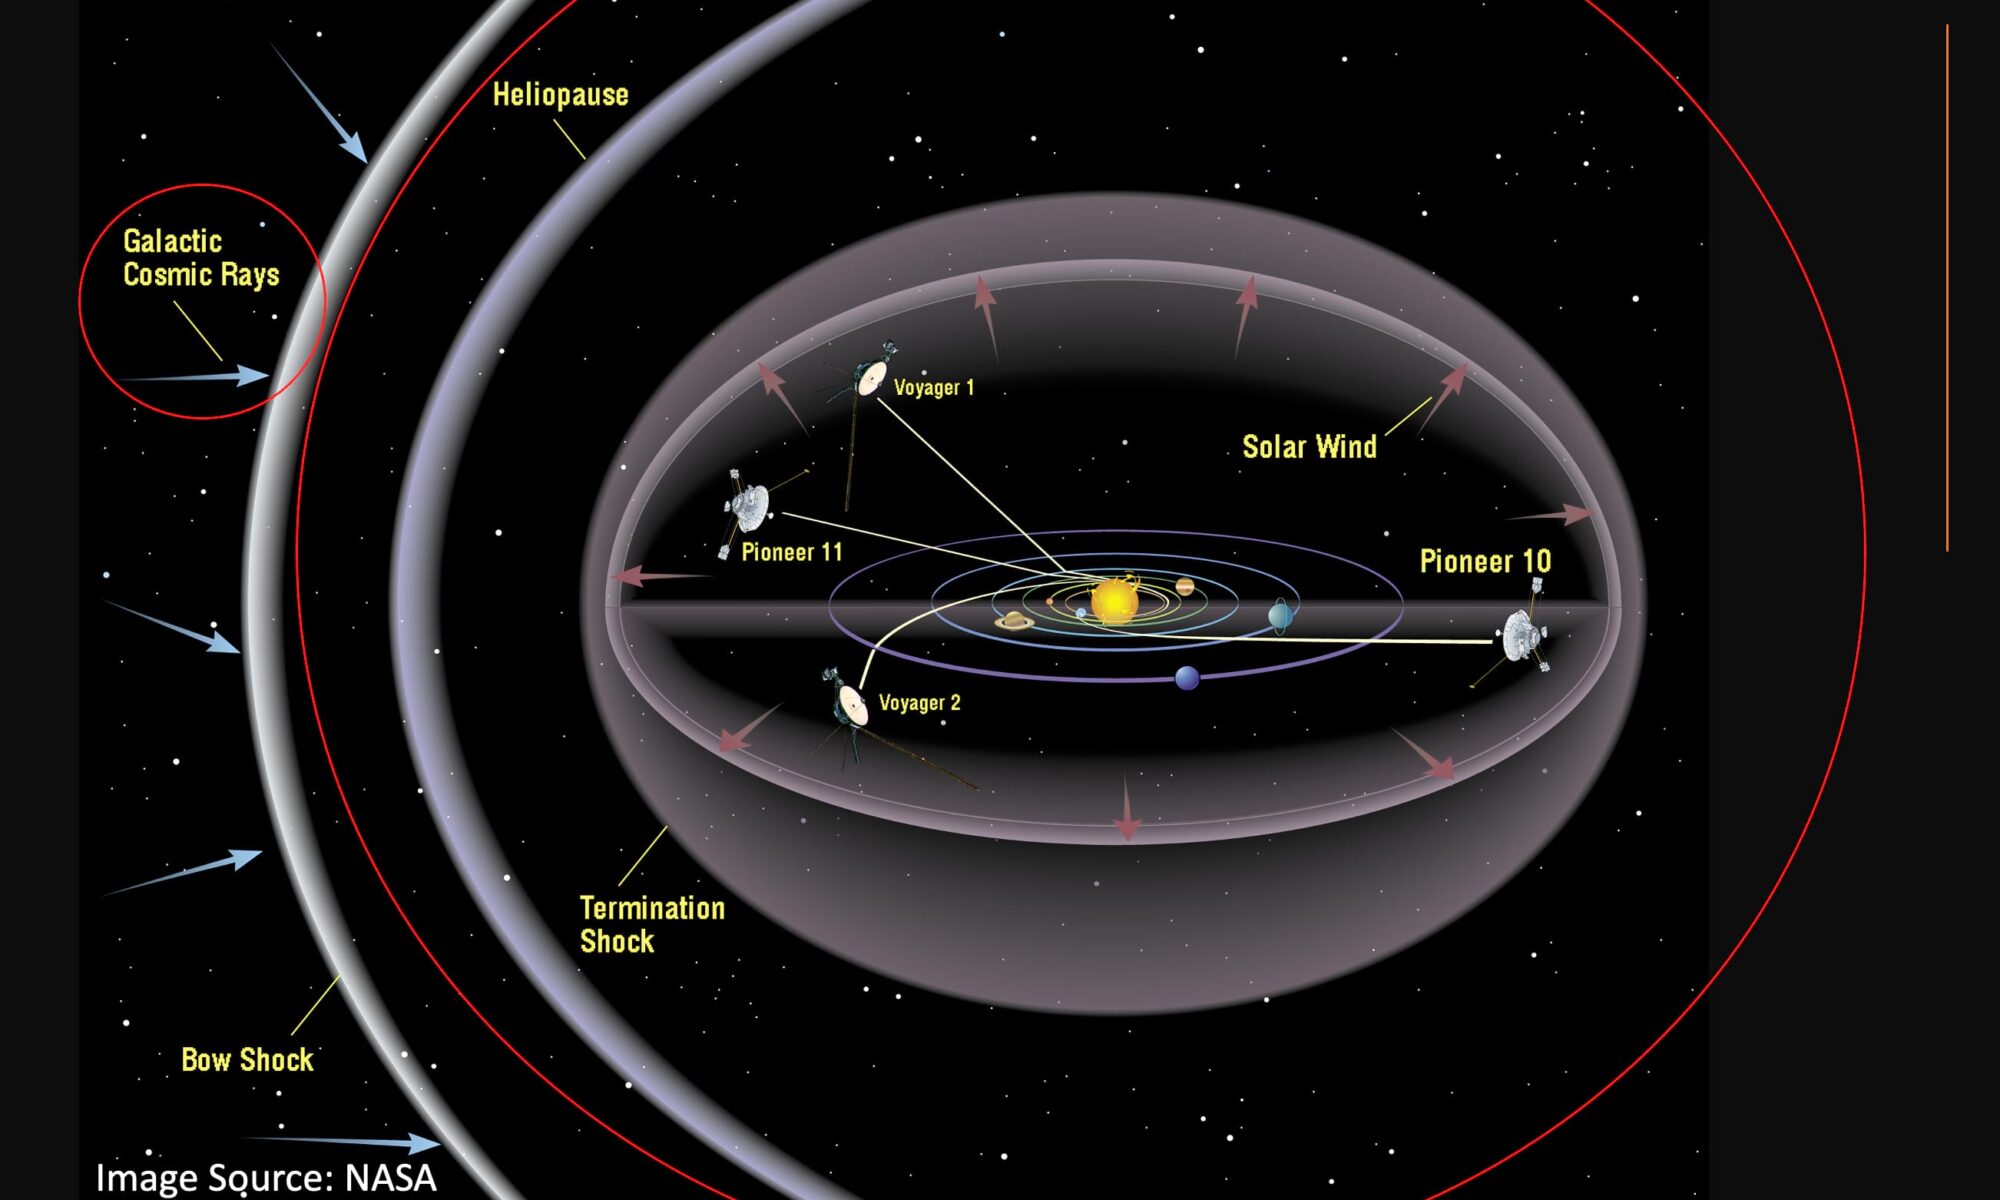
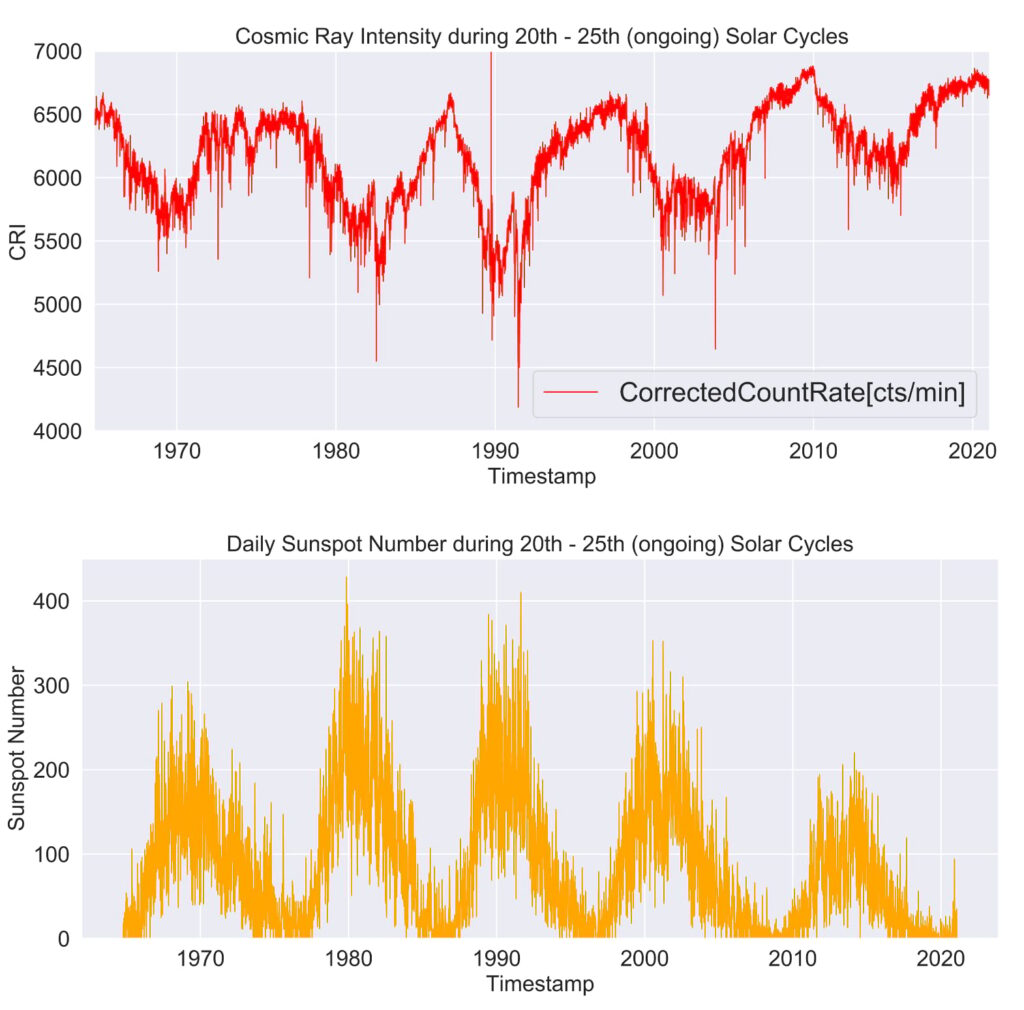
In this study, we download and analyse electromagnetic data of sunspot numbers (SN) from1964 to 2021. We repeat the investigations carried out by previous studies which explore how solar activity correlateswith the rate of cosmic radiation detected on Earth. Solar storms can create extreme electrical conditions on Earth and affect communication systems, GPS, and damage satellites, which can take many years to restore. Also, cosmic rays can cause damages to living cells because of their ionizing energy. We compare both electromagnetic radiations during solar cycles 20-24 and the ongoing solar cycle 25, and observe that galactic cosmic rays intensity and SN are negative-correlated ( Oloketuyi et al. 2020). Such observation indicates that low solar activity allows galactic cosmic rays to grow stronger on Earth. Therefore, variations of the cosmic radiation flux into the heliosphere registered on our planet happens as a consequence of the strengthen and weaken of the recent solar cycles. Also, solar cycle 24 appears to be weaker than previous solar cycles, giving rise to the expectations that solar cycle 25 will be similar or weaker than the previous.
Figure 1. Cosmic ray intensity and sunspot number from 20th to the ongoing 25th Solar Cycle, top and bottom figures, respectively.
By Stephanie Rodriguez, GEG outreach report (2021)
References
Giancoli, D. C. (1992). Physics: Principles with applications (3rd ed). Englewood Cliffs, N.J: Prentice-Hall.
Oloketuyi, J., Liu, Y., Amanambu, A. C., & Zhao, M. (2020). Responses and Periodic Variations of Cosmic Ray Intensity and Solar Wind Speed to Sunspot Numbers. Advances in Astronomy, 2020, 3527570. https://doi.org/10.1155/2020/3527570
If you would like to know more about Stephanie’s outreaching experience, or are interested in the data/codes she has downloaded/wrote, please let us know!
Last April, I decided to ride 200 km to raise awareness and support the prevention and treatment of people with cerebral palsy (CP) around Australia. Thank You so much to all my fantastic donors/HEROES for your amazing support! The money we raised together is going to help those kids to live their best lives! <3 <3 <3
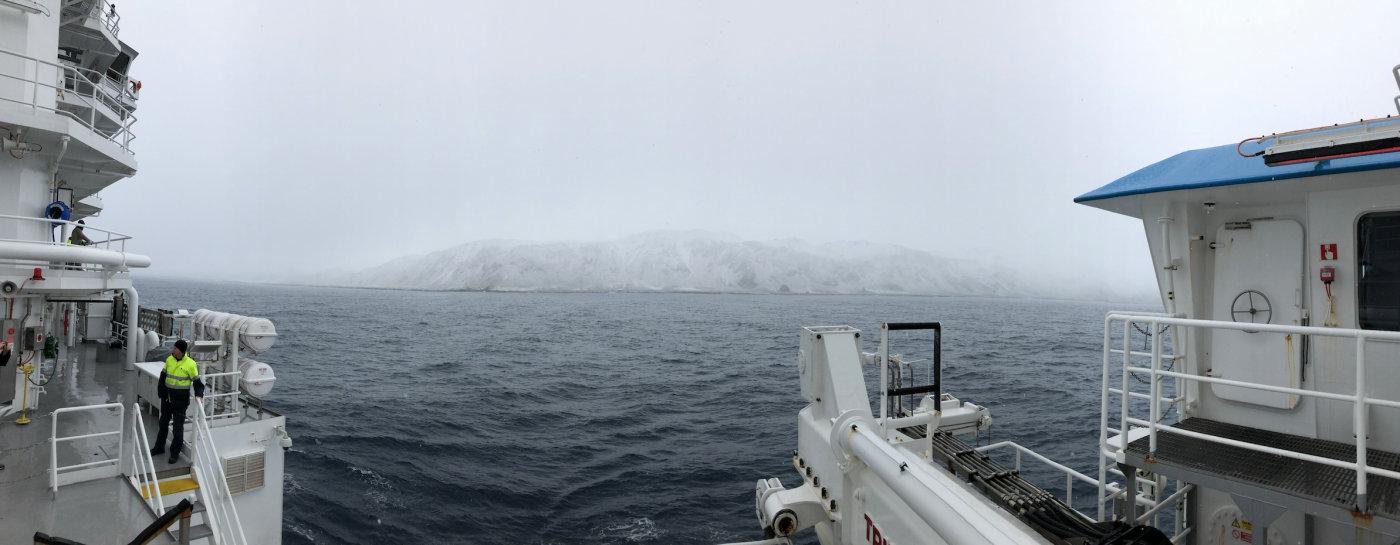
Would you like to see some nice photos of wildlife and landscape near Macquarie Island? Or to know what sea monsters sound like? Or what sort of things I was doing during my spare time on the ship? Read the blog I wrote for OnCirculation!
It is so cool to be an #RSESrockstar ! I invite you to read my blog shared last week on OnCirculation as I talk about what we are doing during this fieldwork on the Southern Ocean! Hope you enjoy reading it 🙂
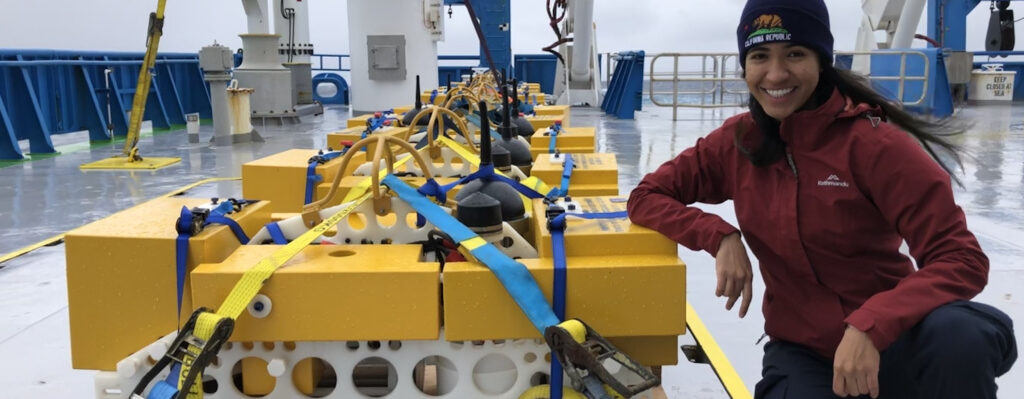
And we are off! Our science team from The Australian National University and IMAS ( University of Tasmania) departed Hobart on the 8th October 2020 onboard the RV Investigator. We aim to deploy ocean bottom seismometers around Macquarie Island, on the Southern Ocean. I am very honoured to be part of this super amazing team!