OVERVIEW

Seismology is the study of the origin and propagation of seismic waves (or elastic waves) through the Earth and other bodies of our solar system. Seismic waves can be naturally generated by earthquakes around the globe – resulting from sudden changes in the Earth’s stress field, or it can be induced by human activity such as by hydraulic fracturing and nuclear explosions. When the seismic waves propagate through the Earth, they carry valuable information about the medium structure. This information can be detected by receivers (seismometers) deployed on the Earth’s surface.

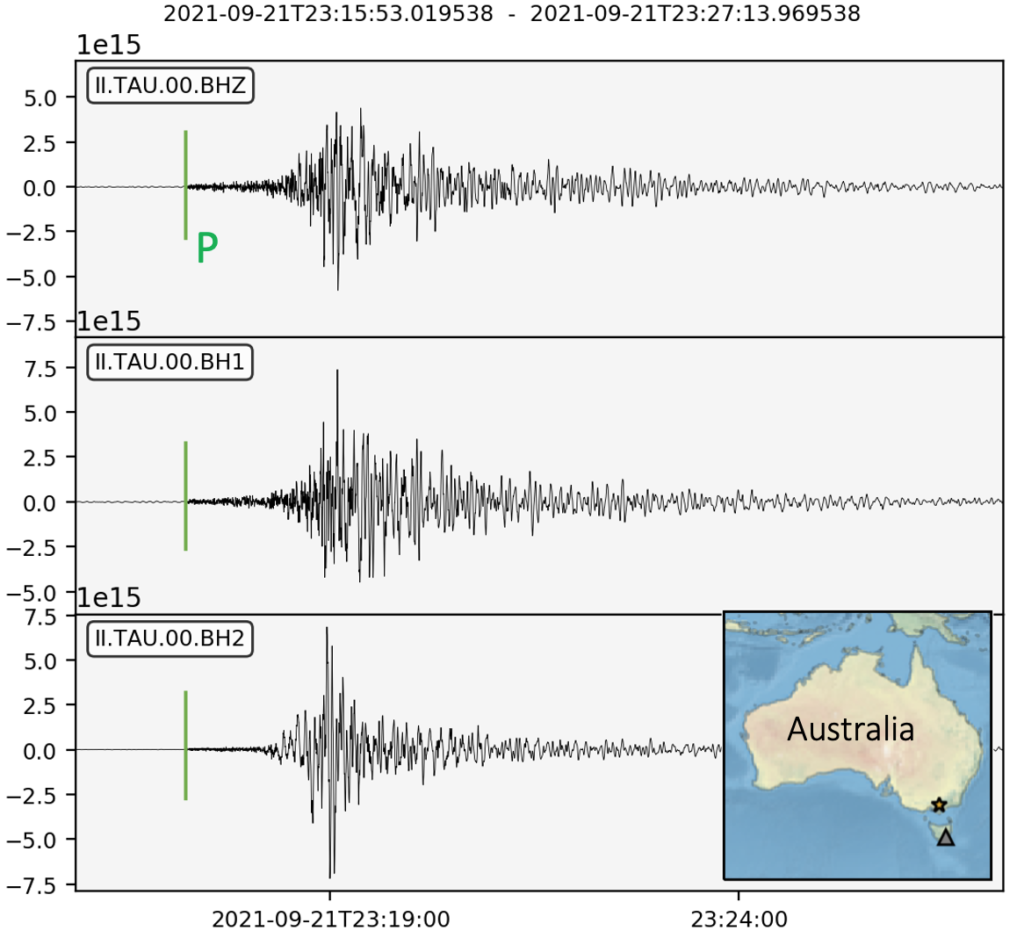
Seismograms (Figure 1) are time series that represent the record of ground motion detected by a receiver due to the passage of a seismic event (such as volcanic activity, landslides, anthropogenic seismicity… the list goes on!). By carefully examining these seismograms, we can investigate the origin of the seismic source (e.g., its location and nature) and the characteristics of the medium through which those waves have travelled.

What is an EarthQuake?

An earthquake is the movement of the ground caused by the sudden release of energy stored in the rocks. The energy radiates from the seismic source travelling as elastic waves and causes the ground to vibrate.

There are different reasons why we have earthquakes, in particular because the Earth is a very dynamic planet! Different types of forces (stress-field) drive the deformation we observe at the surface, creating a perfect condition for accumulation of energy in the crust. When the energy overcomes the limit of deformation, the rocks may abruptly fracture and move, causing an earthquake.

How can we decipher the seismogram into properties of the Earth structure?

Well, we can think of a seismogram as a complex overlapping of effects related to the seismic source, instrument, and the Earth’structure in between the source and receiver. Meanwhile we have a good knowledge about the instrumental response of the seismometer that is recording an earthquake, the source and Earth’ structure are more challenging to be determined, thus being the object of investigations of all seismologists.

On another post, I will describe a bit more about the waveform modelling (how we can mathematically decompose a seismogram), and introduce to you some fundamental equations.

Figure 1. Recordings of the ground displacement at different components of station TAU (Hobart, Tasmania, Australia) produced by seismic waves from an MW 5.9 earthquake in Victoria, Australia on 21st September 2021. Map to the right-bottom shows the earthquake (star) and station (triangle) location. Green lines indicate the approximate time arrivals of P wave.

!!! Seismograms displayed in Figure 1 !!!

There are multiple ways you can download the waveforms displayed above, such as by:

1) Using obspyDMT. Here is an example on the command line you can type on your terminal (make sure you have obspy installed in your machine!)

Untitled1
In [ ]:
obspyDMT --datapath event_based_dir --min_date 2021-09-21 \
--max_date 2021-09-22 --min_mag 5.8 --max_mag 6.0 --event_catalog IRIS\
--data_source IRIS --net "II" \
--sta "TAU" --cha "BH?" --preset 20 --offset 1800

obspyDMT is super handy and highly recommend you to familairise yourself with it!

2) Using IRIS Wilber 3

3) Using FDSN client for obspy.

On another blog, I will show you step by step on how to display the seismograms in different ways. For now, just a quick and dirty plot:

#! /usr/bin/env python

import obspy
from obspy import read

st = read('II.TAU.00.BH?*.SAC', format='SAC')
st.plot(linewidth=0.3,bgcolor='whitesmoke')

Click here >>> Waves and Seismograms >>>